
The PostgreSQL collector subsystem is responsible for the collection and reporting of the statistical information for the PostgreSQL database server. The information gathered by the collector provides insights on how the various database objects such as tables, indexes, functions are in use by the applications. The statistical information is produced within various PostgreSQL processes.
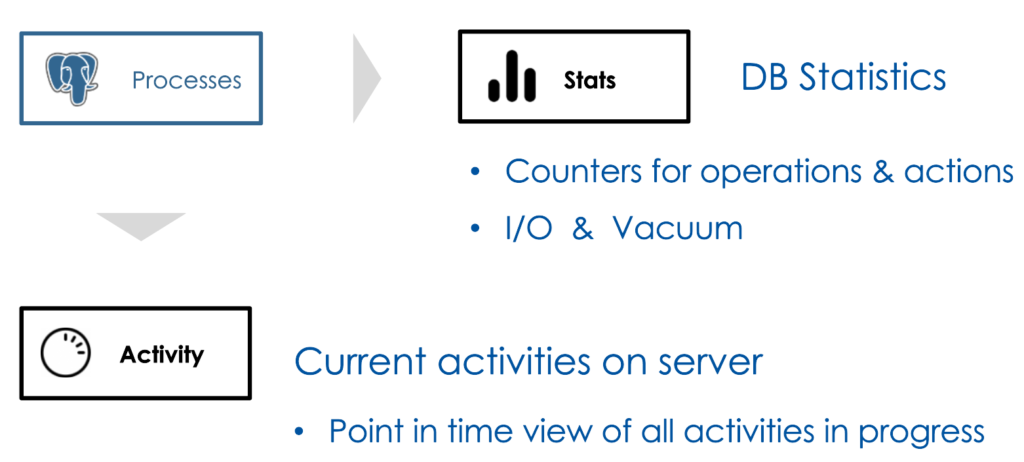
In fact there are two types of stats gathered by the collector. The DB Statistics is the object level stats data which consists of counters for SQL operations, I/O, vacuum & analyze runs. The Activity stats is the point in time information on the query or command that is getting executed.
It is important to keep in mind that processes do not send the stats instantaneously. In other words the information you are seeing may not reflect the accurate state of the system at that moment.
Accessing the stats
The statistics gathered by the collector is made accessible by way system views. Users may run queries against these views to get the information of interest. The stats views are categorized under two headings.
Collected stats views provides access to the database object stats e.g., tables, indexes, functions
E.g., pg_stat_database exposes counter stats for databases
E.g., pg_stat_user_indexes exposes counter stats for user defined indexes
Dynamic stats views provides access to info on running SQL and commands
E.g., pg_stat_activity provides state of the running query
E.g., pg_stat_replication exposes stats for the WAL sender processes
In this blog I will walk you through some of these views but I will encourage you to check out the other stats views for better understanding of all the useful information available to you.
Configuration
There are multiple parameters that controls the behavior of the stats collector. The default configuration enables the gathering of all stats and activities. In a database that is under heavy use, there may be some amount of overhead due to the collector subsystem. If you believe that stats collector is causing an unacceptable performance penalty then you may use the configuration parameters to disable it.
| DB Stats | track_counts Enable/disable counters for tables, & indexes track_functions Enable/disable counters for functions track_io_timing Enable/disable stats gathering for block reads & writes |
| Activity | track_activities Enable/disable monitoring of currently running SQL & commands track_activity_query_size Amount of memory reserved for SQL text (1024 bytes default) |
To check out the setup for your PostgreSQL instance use the commands:
SHOW  tracK-counts;
SHOW  track_activities;
Database stats
The database level stats is available in the view pg_stat_database. Data for each database in the instance are maintained in a single row. Let’s run the following query and check out the counters for a specific database. I have database named ‘labdb’ on my instance, please change it to some database that is setup on your instance.
\x
SELECT *
FROM pg_stat_database
WHERE datname='labdb'
The output from this provides counters for the database operations, deadlocks, etc. One particular counter of interest is the numbackends that holds the count of number of connections to the database.

PostgreSQL allows multiple databases to share resources on an instance. If one of the database on the instance starts to carry out excessive IO then other databases on the instance will suffer from IO lag. This is because the IO bandwidth on a VM is limited. This situation may manifest itself as overall database server performance degradation.
Database stats captures the IO timing for databases if the config parameter track_io_timing is set to ON. If you see a database carrying out excessive IO leading to performance impact on the other databases then one of the choice is to move that database to its own instance. Try out the following query to check the databases that are using the most IO.
SELECT datname, blk_read_time,blk_write_time
FROM pg_stat_database
ORDER by blk_write_time;
Table stats
All table level stats is accessible by way of the view pg_stat_all_table. The view pg_stat_user_table provides information on the user tables only. Stats data for each table is maintained in a single row in this view. In this part of the blog, I will show you how to use the table level stats to identify performance issues related to a table.
E.g., your user is complaining that the performance of queries against the tables is degrading over a period. Clearly something is changing for the table that is causing the behavior. Table level stats may help in this situation. Let’s go over the pg_stat_user_tables view to understand how we can use the information in it to address common table related issues.
--Create a test table
CREATE TABLE test AS
SELECT id, md5(random()::text) AS text
FROM generate_Series(1,5) id;
--Get the stats & check the attribute n_tup_ins & n_live_tup
\x
SELECT * FROM pg_stat_user_tables WHERE relname='test';--Run a delete statement to delete 10 rows
DELETE FROM test WHERE id = 5;--Get the stats again
SELECT * FROM pg_stat_user_tables WHERE relname='test';This is how the stats for the table looks like at this time. Table contains 4 live tuples, 1 dead tuple, 5 rows served via a SELECT statement. It also has information on the last vacuuming and analyze runs.

Activities in progress
So far the stats I have discussed is static in nature as it builds over a period. It provides insights on the performance based on the data gathered from past. What if database performance is degraded when a specific query (or set of queries) are run? In that scenario you may get the stats for the running query from the pg_stat_activity view. The idea is that query performance is predominantly determined by the amount of time a backend process has to wait to get access to a resource needed for processing the query. For example if the table that needs to be updated is locked then then the backend process will need to wait for the table lock to be released. What I described is just one of the wait events.
The activity view provides stats information for the backend connections to the Postgres instance. For each of the connections you can check the wait state of the connection. Once you are able to identify the wait event causing the query performance degradation, you may then address it by tuning the query or the database.
Lets try out an experiment.
1. Open up a session#1 for psql and run the command to get the PID for the backend process, save the pid. And then lock the table in a transaction.
-- Session#1
SELECT pg_backend_pid();
-- Session#1
BEGIN;
LOCK TABLE test;2. Open up a session#2 for psql and run the following command.
-- Session#2
SELECT pg_backend_pid();

-- Try to insert in the locked table
UPDATE test SET id=id+1;
3. Open up a session#3 for psql. Now you need the pid for session#1 & session#2. Make sure to replace the PID for the sessions in the query below. This query will show you the current state of the backend processes.
--Session#3 pull the current state of the running backend processes
SELECT *
FROM pg_stat_activity
WHERE pid=11481 OR pid=1462;
The session#1 and session#2 are in different wait states. The query executed in session#2 is waiting on a lock to be released on a table. This is indicated by wait_event_type and wait_event attributes. The client connect state indicates if on a connection there is a running query, so in this example session#2 is active whereas for session#1 the backend process is waiting.

No lets release the lock by commiting the transaction in session#1. This will lead to the session#2 query to complete as the lock will be released on the table.
--Session#1 - release the lock by committing the transaction
COMMIT;
Now check the state of the two backend processes again by running the query.
--Session#3 pull the current state of the running backend processes; change PIDs
SELECT *
FROM pg_stat_activity
WHERE pid=11481 OR pid=1462;
This time you will find that both session#1 and session#2 will have:
wait_event_type = client
wait_event = ClientRead
state = idle
Which indicates that the backend process is waiting for the client to send a command/query. The state = idle indicates that the session is not putting any CPU/IO load on the server but keep in mind that an open connection does consume memory on the server.
Conclusion
In this blog I discussed the PostgreSQL stats collector at a high level. We also looked at 3 commonly used stats view that you can use for addressing performance issues on your PostgreSQL databases. In a later blog I will dive deeper into the use of some of these stats views to address common performance challenges.